Trackman Data Points Explained | The Swing Lab
What Do All 26 TrackMan Data Points Actually Mean?
You’ve hit a shot. The numbers flash up on screen. But what does it all mean — and why should you care?
At The Swing Lab, our TrackMan iO captures 26 key data points every single time you swing. This isn’t just numbers for the sake of numbers. It’s the same technology trusted by tour professionals to diagnose, improve, and perfect their game. Here’s your complete guide to every metric — and what it’s telling you about your swing.
Club Data — What Your Club Is Doing
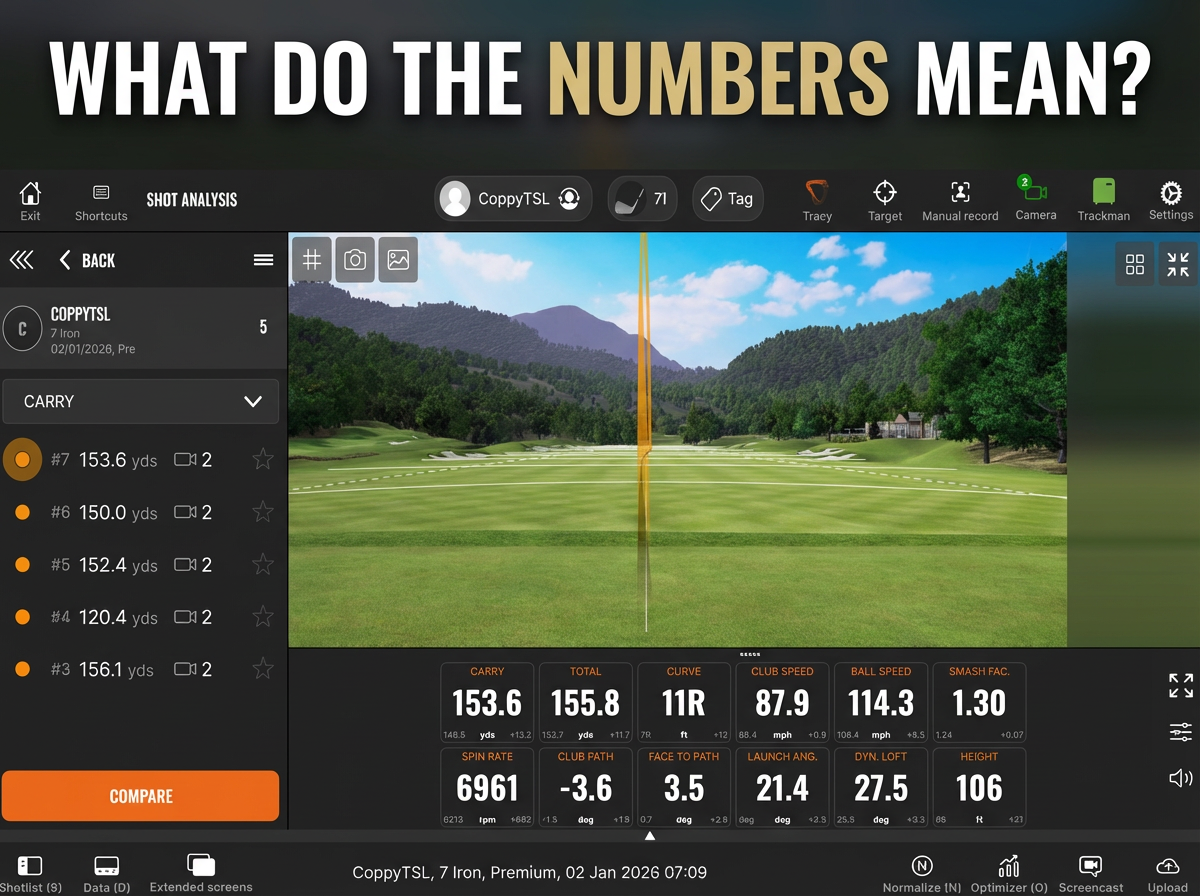
1. Club Speed - How fast the club head is moving just before impact. More speed = more potential distance. But raw speed without control is wasted power.
2. Attack Angle - Whether the club is moving upward or downward at the moment of impact. Hitting down on irons and up on the driver is the golden rule — and this number tells you exactly what’s happening.
3. Dynamic Loft - The actual loft of the club face at impact — not the loft stamped on the club. This directly controls launch angle and spin rate. Most golfers are surprised by how much this changes shot to shot.
4. Club Path - The direction the club head is travelling through impact — in-to-out or out-to-in relative to the target line. This is one of the biggest drivers of shot shape. In-to-out = draw bias. Out-to-in = fade bias.
5. Face Angle - Where the club face is pointing at impact. This is the single biggest factor in determining where your ball starts. Face angle accounts for roughly 75–85% of initial ball direction.
6. Face to Path - The difference between face angle and club path. This relationship is what creates curve. A face open to the path = fade/slice. A face closed to the path = draw/hook.
7. Spin Loft - The angle between the club head’s direction of movement and the club face orientation at impact. Higher spin loft = more spin and higher launch. Lower spin loft = lower, more penetrating ball flight.
8. Swing Plane - The vertical angle of the arc your club travels on. Think of it as the “tilt” of your swing. Steep or shallow — this tells you exactly where you sit.
9. Swing Direction - The angle of the swing’s base relative to the target line. Different from club path — this gives a broader picture of the overall direction your swing is travelling.
10. Low Point - Where the lowest point of your swing arc falls relative to the ball. Hitting before low point = fat shots. After = thin. Getting this dialled in is crucial for consistent ball striking.
11. Impact Height - The vertical location of where the ball makes contact on the club face — above or below centre. Strike it high on a driver and you gain distance. Low on the face and you lose it fast.
12. Impact Offset - The horizontal location of contact on the face — heel or toe. Toe strikes lose speed. Heel strikes can cause hooks. Centre face is where the magic happens.
13. Dynamic Lie - The angle of the shaft relative to the ground at impact. If the lie is too upright or too flat, it affects face angle and ball direction — even with a perfect swing.
Ball Data — What the Ball Is Doing
14. Ball Speed - The speed of the ball immediately after leaving the face. Ball speed is the direct output of your swing — it’s what creates distance. The faster the better, as long as it’s controlled.
15. Smash Factor - Ball speed divided by club speed. This is your efficiency rating. A smash factor of 1.50 on a driver is the benchmark for a perfectly struck shot. Lower than that? Energy is being lost somewhere.
16. Launch Angle - The vertical angle the ball launches at after impact. Too low and you’re losing carry. Too high and you’re ballooning. Every club has an optimal launch angle — TrackMan tells you exactly where you are.
17. Spin Rate - How fast the ball is spinning after impact, measured in RPM. Spin stabilises flight but too much kills distance. Too little and the ball won’t hold greens. Dialling in spin rate is key to consistent performance.
18. Launch Direction - The horizontal angle the ball launches relative to the target line. Combined with face angle data, this tells you exactly where your shots are starting — and why.
19. Spin Axis - The tilt of the ball’s spin axis — this is what creates curve. A tilted axis left = draw. Tilted right = fade. The more tilted, the more curve. Straight axis = straight ball.
20. Apex Height - The maximum height your ball reaches during its flight. Too low and you won’t stop the ball on greens. Too high and you’re losing distance to the wind. Optimal apex varies by club and course conditions.
21. Curve - The total horizontal movement of the ball from the launch direction to where it lands. This is the real-world result of your spin axis — how much the ball actually moves left or right in the air.
22. Landing Angle - The angle at which the ball descends back to earth. Steeper landing angles help the ball stop quickly. Shallower angles mean more run. Critical for approach shots into firm greens.
Distance Data — Where the Ball Ends Up
23. Carry - The distance the ball travels through the air before landing. This is your true flight distance — unaffected by roll. Essential for club selection, especially on approach shots.
24. Side - How far left or right of the target line the ball lands (carry only). Positive = right of target. Negative = left. This is your accuracy number in the air.
25. Total - The straight-line distance from launch to the ball’s final resting position, including roll. Your headline distance number.
26. Side Total - How far left or right of the target line the ball ends up after rolling out. The final verdict on accuracy. This is what actually matters on the course.
Why These Numbers Change Everything
Most golfers spend years guessing — trying to fix a slice by changing their grip, or chasing distance by swinging harder. TrackMan removes the guesswork entirely. When you can see exactly what your club face is doing, where your path is going, and how the ball is reacting, improvement becomes a straight line rather than a maze.
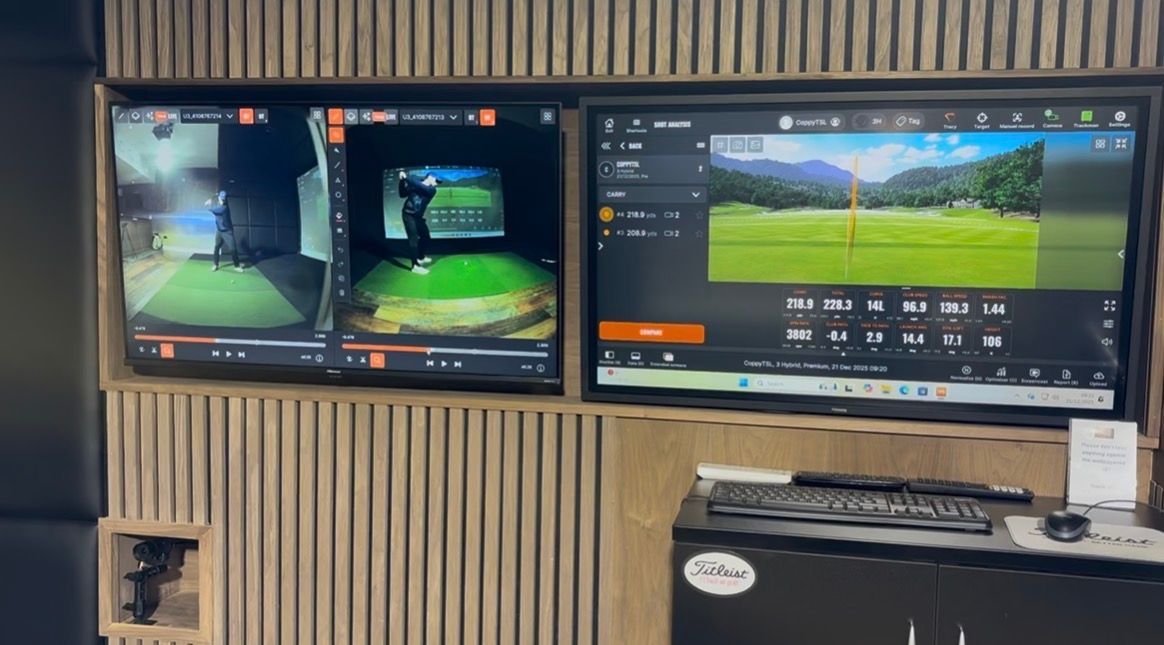
That’s exactly what we’ve built The Swing Lab for. Every session in our private bay gives you access to all 26 data points, in real time, with zero distractions.
Ready to see your numbers? Book your session at theswinglab.co.uk